The MTS Biotech IPO Monitor – Edition 3: H1 2018 Update – Will 2018 Beat the 2014 High Tide Mark For Biotech IPOs?
This is the third edition of our “MTS US Biotech IPO Monitor” where we will use our proprietary database* to generate and discuss thought-provoking statistics and observations. IPO Monitor is one of the pieces published by Strategic Advisory Analytics group at MTS. MTS’ “Strategic Advisory Analytics” reports exemplify our value add strategic advisory services to clients across all healthcare industry sub-sectors. A redacted version of the IPO Monitor can be accessed here. Corporates and institutional investors can request a full version by sending an email to any partner at MTS.
A strong H1:2018 on number and initial IPO valuations…
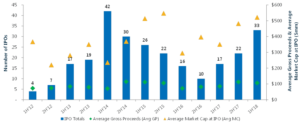
- H1:18 was a strong first half in terms of the number of IPOs; 33 in H1:18, vs. 17 in H1:17, 16 in H1:16, 26 in H1:15, but lower than the banner 42 in H1:14
- H1:18 average raise/post money valuation was stronger that full previous years at $106/$521m vs. FY17 $100m/$425m, FY16 $76m/$334m, FY14 $89m/$291m, but lower than the FY15 $109m/$529m
…with a scattered performance
- 19 out of the 33 H1:18 IPOs have posted gains at an impressive average of +49%; The 14 underperformers have an average loss of -23%
- Mean IPO to current performance for class of H1:18 +19% vs. class of 2017 +67%, class of 2016 +80%, and class of 2015 +20%
2018 Shaping to be the Best for this Industry – Gene Therapy and foreign issuers continue to be red hot
- The number of potential IPO candidates in the pike continues to pressure the time capacity issue to vet companies from the buyside
- The total post money valuation hit an all time high at $17.2Bn in H1:18 (partly bolstered by the Morphosys ADR listing)
- The strong momentum in Gene Therapy companies continued in H1:18 with 8 IPO companies or 24% of all H1:18 IPO’s. Post Money valuations for these Gene Therapy companies at a high at $510m
- Four foreign issuers accessed the US markets, which compares to 7 in FY 2017 and 2 in FY2016
5 Key Messages From Detailed Analysis of 2012-Q1:2018 IPOs
- “Quality” Over Stage of Asset: Pre-Clinical/PI IPOs Have Higher Raises and Valuations than PIII Companies
- Gene Therapy Companies Continue to Garner Higher Raises and Valuations than Small Molecule Companies
- 85% of IPOs Are Still Trading As Original Entities; Exits: 9% M&A, 4% Reverse Merger, 2% Bankrupt or Delisted
- Foreign Issuers Have Broad Access to US Capital Markets – Higher Quality Companies Eventfully Gravitate to US listings
- ~30% Insider Participation Continues to be an Important Factor for a Successful IPO
*MTS IPO Database
The MTS bespoke IPO database includes the 805 US Biotech IPOs from the first 1979 US Biotech IPO with micro detailed analysis from 2012. Special thanks to Stelios “The Godfather” Papadopoulos for the historic data.
Securities related transactions are provided exclusively by our affiliate, MTS Securities, LLC, a broker-dealer registered with the SEC and a member of FINRA and SIPC. This Strategic Advisory Analytics report does not qualify as research pursuant to FINRA Rule 2711. A related party, Windrose Health Investors, LLC, an SEC registered investment adviser, provides investment advisory services to private equity investors. This publication may not be copied, reproduced or transmitted in whole or in part in any form, or by any means, whether electronic or otherwise, without first receiving written permission from MTS Health Partners, L.P. and/or its affiliated companies (collectively, “MTS”). The information contained herein has been obtained from sources believed to be reliable, but the accuracy and completeness of the information are not guaranteed. All products, names, logos and brand references are the property of their respective owners. All third-party company product, and brand references used in this publication are for identification purposes only. Use of these names, logos and brand references does not imply endorsement by MTS. The information in this publication is not intended to constitute a recommendation upon which to base an investment decision. Neither MTS nor any of its associated persons are affiliated with the companies referenced in this publication nor to date, has MTS provided financial advisory services to these companies, although it may provide or seek to provide such services in the future

